Created by Brenton Crawford, Mark Grujic and Harvey Nguyen.
The problem with unstructured core imagery
Core photos provide a great visual for understanding geology and validating observations, but what if you wanted to use them to extract numerical data for quantitative analysis?
Historically, quantitative analysis of core photography has been difficult to undertake due to typical core photos being what are called unstructured data.
Core photos are considered unstructured data due to:
- Imagery itself lacking spatial/depth registration information
- Regions of the image containing irrelevant non-geological material
- Pixels of interest not having appropriate context
The opportunity
Using the Datarock platform we can ingest this unstructured core photography and convert it into a high-value, structured dataset. Datarock provides various image formats that can allow the imagery to be:
- Analysed quantitatively for colour and textural information
- Fused with other ancillary downhole datasets (read our previous article on that topic)
- Spatially represented accurately downhole in 3D.
Cropped box imagery
The first step to creating structured versions of core imagery is to convert raw core photographs into cropped individual core boxes that have been both geometrically corrected and depth registered using this process:
- Perspective de-warp – a correction that aims to remove perspective distortion caused by the camera not being positioned perpendicular to the core box
- Box cropping – segmenting the core box from the total image
- Depth registration – see previous Datarock blog for a detailed explanation on how we do depth registration
How to easily download a box images:
These images have a known start and end depth and have removed spurious information from the background and margins of the core image itself.
These cropped core box images are neater to visualise and store but still require some more processing before they can be quantitatively analysed.
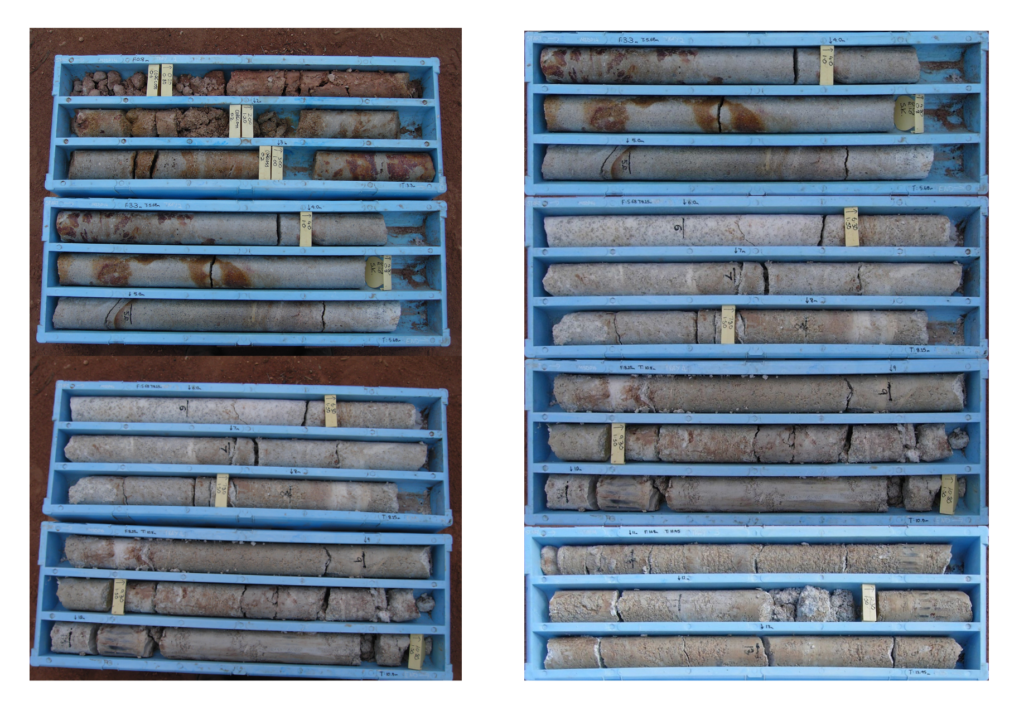
Figure 1 – (Left) Raw unstructured core photography. (Right) Datarock cropped, depth registered and de-warped core box imagery
Cropped row imagery
Using the Datarock platform we can go one step further and crop each row of core from within one or more core boxes automatically. These cropped row images can be downloaded from the Datarock platform and used externally.
How to download various types of enhanced row imagery:
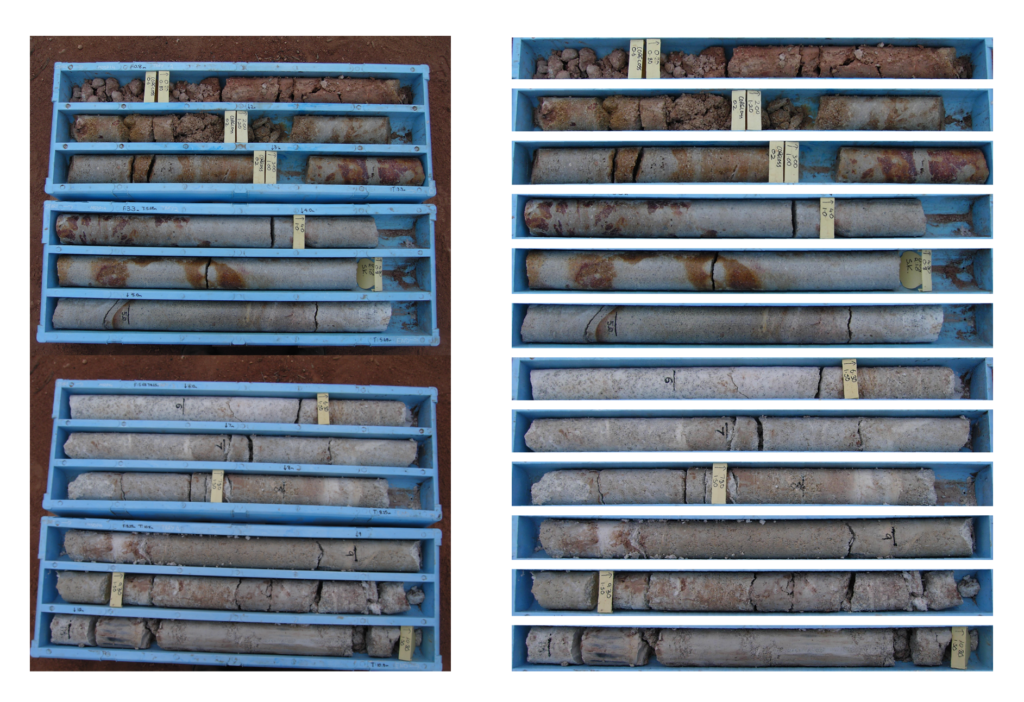
Figure 2 – (left) Raw unstructured core photography. (right) Datarock cropped row imagery
Analytics-ready imagery
To maximise the ability for these row images to generate quantitative data, we produce several enhanced variants of the row imagery that cater for different data science and visualisation use cases.
The key to allowing imagery like this to be used for data analytics is to isolate the portions of the image that contain the information of interest and remove the non-rock portions that create noise and complexity for the analysis.
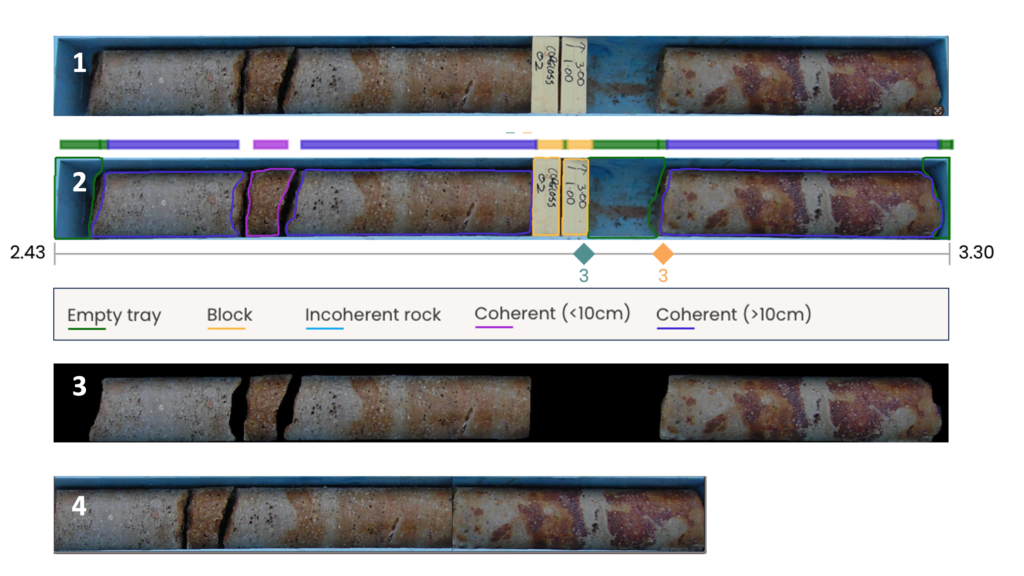
The image below shows the various structured row imagery that is available to be visualised in the platform and downloaded.
1 – Cropped row image (downloadable)
2 – Fully detected row image that is depth registered (visualised in the platform)
3 – Row image with non-coherent rock masked black (downloadable)
4 – Row image with non-rock material removed from the image length (downloadable)
How to batch-download imagery:
Representing core image data in 3D
A core tray image may contain as much as 40% non-rock material such as core blocks and empty space!
When you download the cropped images from the Datarock platform, you can set the download to ignore the core blocks and empty space, leaving only depth registered “rock only” imagery. The cool thing about that download is that the original core tray photo can now be represented as close as possible to the geology in the ground.

Figure 4 – (Left) Raw cropped rows with their original image length. (Centre) Row image with non-coherent rocks nulled. (Right) Rock-only row image with non-rock image length removed (magnitude of removal shown in red).
Textural analysis and image domaining
Once the core imagery is in the correct structured format, it is possible to use this imagery for a wide variety of image analytics tasks.
One powerful workflow involves clustering or domaining the imagery into groups with similar visual appearance in terms of colour and texture.
- Generate a clean image input for analysis that contains only coherent rock textures
- Create a set of variables that describe each image visually (in high dimensional space)
- Use a dimensionality reduction algorithm that can transform this high dimensional space into a lower dimensional representation that can be visualised (in 2D or 3D)
Critically, this workflow relies on an input of clean, rock-only imagery that does not contain broken rock or non-geological material to avoid producing image populations that are unrelated to the character of the rock.
This workflow was covered in detail in this blog article.
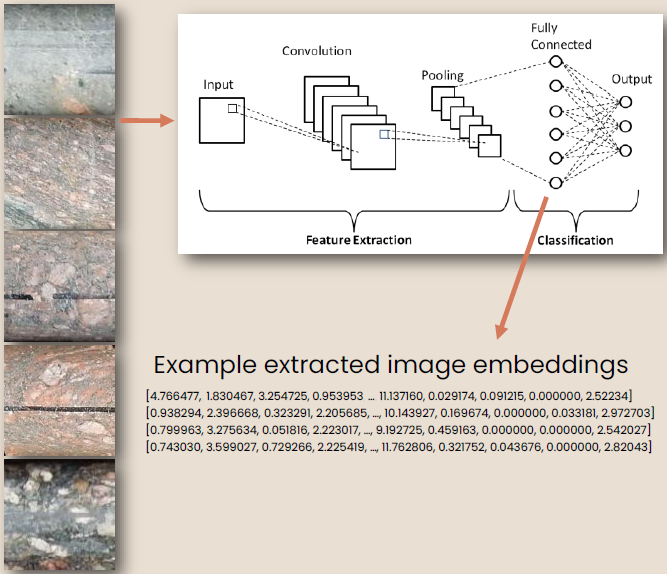
Figure 5 – Schematic showing how image embedding (numerical descriptors of the image) are extracted from a rock image tile using a Convolutional Neural Network.
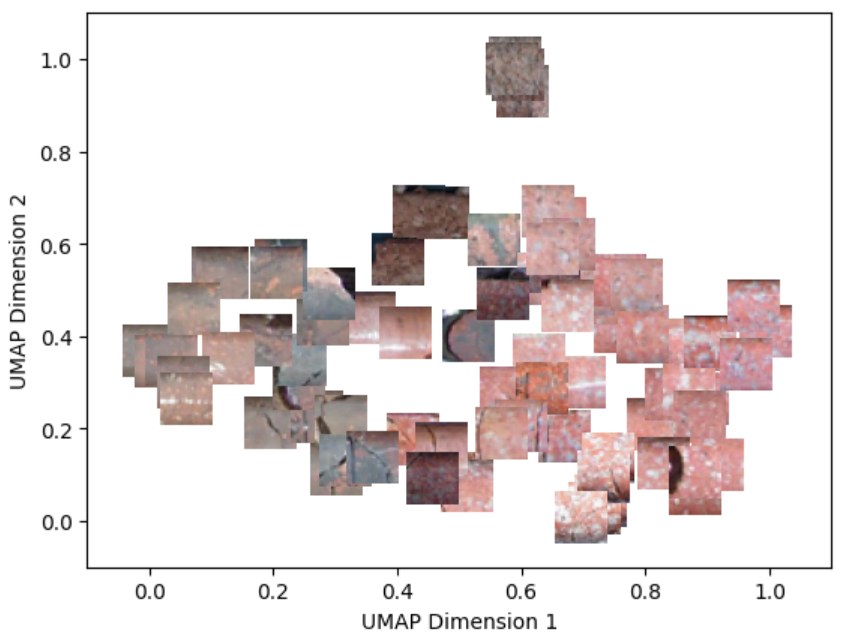
Figure 6 – 2D UMAP of image tiles extracted from Datarock rock-only rows image. Each data point is represented by the tile image. Visually similar imagery should plot together in UMAP space.
Get in touch to find out more about how Datarock can maximise the value in your core by leveraging core imagery to build quantitative insights.

