Created by Katie Silversides
This blog is adapted from: Katie Silversides, Jack Maughan and Mark Pawley 2024, Mapping geology using textural feature extraction and unsupervised community detection models on airborne geophysics, presented at the 37th International Geological Congress, Busan, Republic of Korea.
In this blog post we show how unsupervised community detection techniques can be combined with computer vision methods to extract and analyse important textural information from regional scale geophysical data, and develop high quality geological maps. Methods like this can aid geological mapping in under-explored areas, or provide useful comparisons with legacy mapping. We will demonstrate how different unsupervised clustering approaches result in a range of outcomes, so as always the domain expert must take care in choosing the right approach for the data at hand.
Geology and Data
Our example area is a section of the Gawler Craton in South Australia. The area contains Archaean to Mesoproterozoic basement (Figure 1), with extensive sedimentary cover. This area was chosen because the geology is considered well understood, and the results of our textural feature extraction and unsupervised modelling can be easily compared with the mapping.
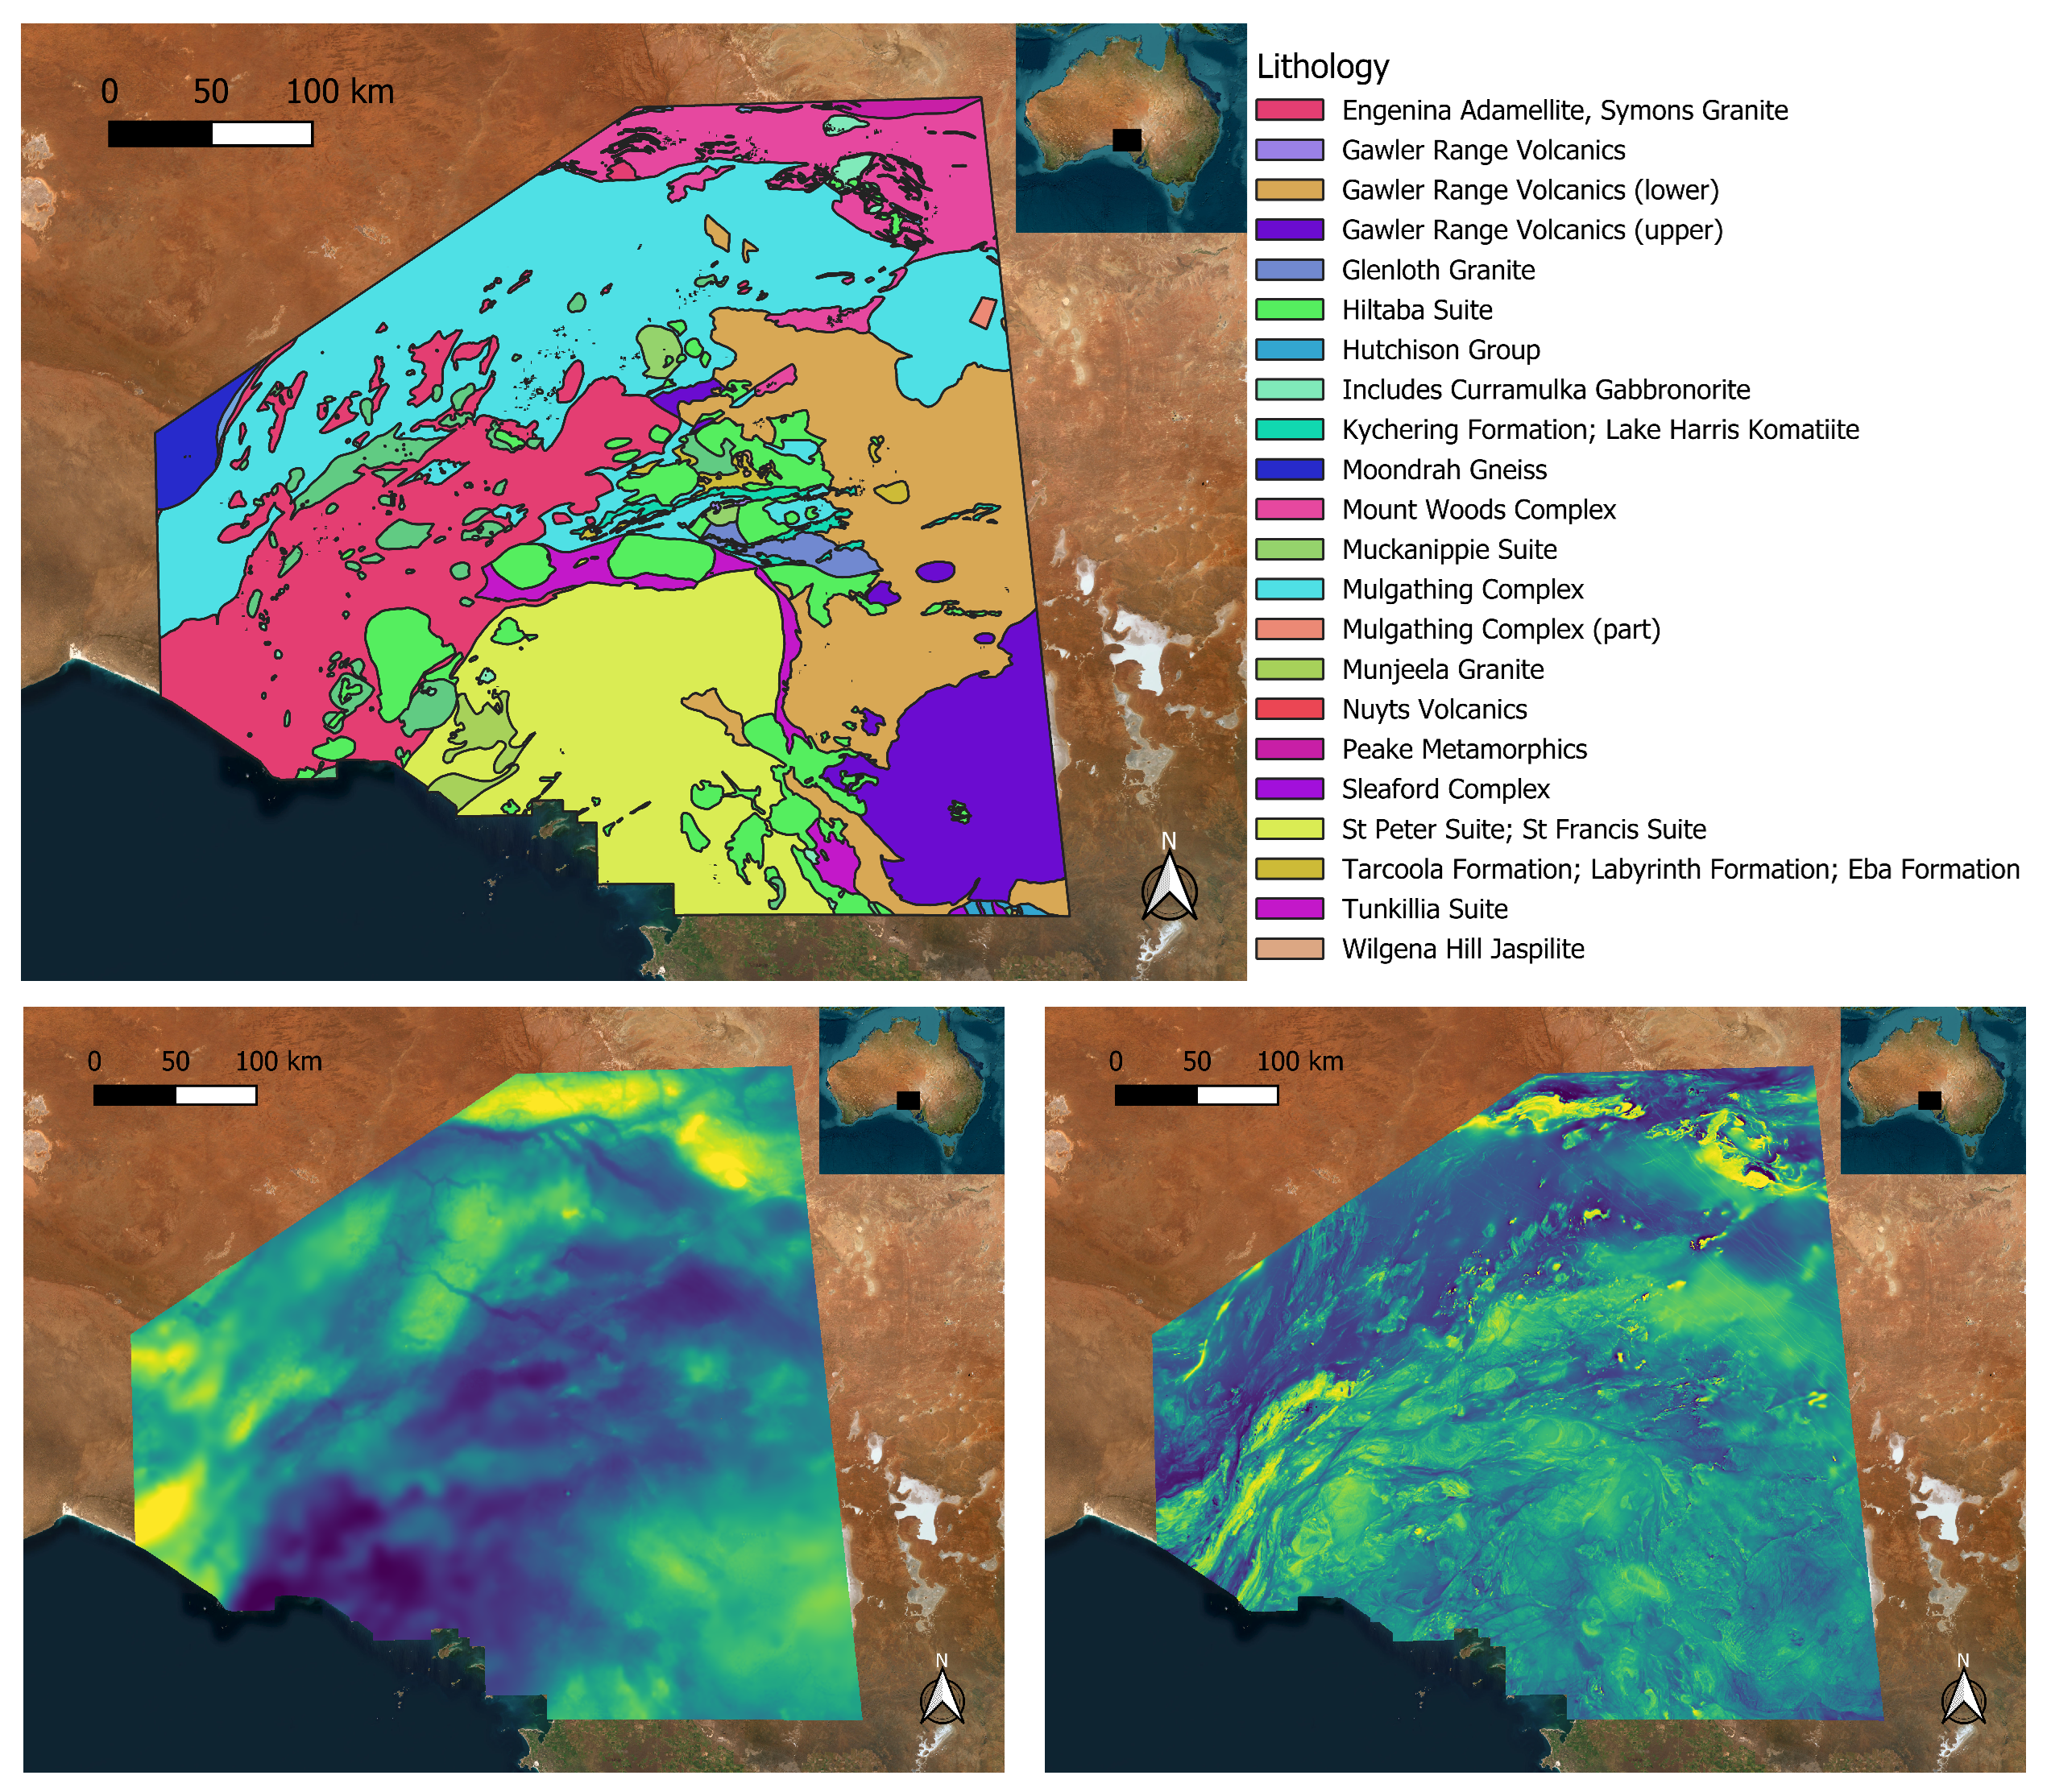
Figure 1: The Archaean to Mesoproterozoic basement lithology in the test area, with the airborne gravity and TMI data.
Airborne gravity and total magnetic intensity reduced to pole (VRTP) contain a wealth of textural information that are known to relate to the geology in the area. The data was stacked into a multi-band image from which a series of 2km tiles were chopped and passed through a pre-trained convolutional neural (CNN) network to extract textural information. To learn more about this process see other Datarock Applied Science blog articles; Fusing core imagery and chemistry to model stratigraphy – Datarock and Geophysical Texture Analysis – Datarock.
Using the extracted features, a dimensionality reduction was then performed using uniform manifold approximation and projection (UMAP). The UMAP produces a graph that can then be used to perform network based clustering via community detection algorithms. Figure 2 demonstrates a 2D UMAP graph of our data.

Figure 2: a 2D UMAP representation of the extracted texture values. The location of each point on the map is based on the two UMAP vectors and the lines are based on the connectivity between points, with edge bundling used to tidy the graph.
Community Clustering Algorithms
When it comes to applying machine learning in geosciences, labels with which to train models are mostly based on interpretations by geoscientists. However, these labels are often incomplete, inconsistent or un-reliable. It can therefore be difficult to know for sure how many true geologically distinct groups are present in the data. Community detection algorithms are hierarchical methods that automatically detect the correct number of clusters based on structure in the data. This is a major advantage above other clustering algorithms like k-means that require the number of clusters to be specified, and are therefore not ideal for solving geological problems.
Community detection algorithms take a graph, such as that produced by the UMAP, and create clusters of data points with similar properties. Unlike classical clustering algorithms, community detection methods use modularity to decide which points belong to a cluster. Modularity is a measure of how comparatively dense the edges within the groups are compared to the density of the connections between groups.
Here we will compare a series of clustering algorithms including Leiden, Walktrap and Louvain with differing modularities, and demonstrate how each of these result in a different outcome when applied to the textural features extracted by the CNN.
Clustering Results
The cluster maps shown in Figure 3 demonstrate that each clustering approach captures different textures extracted from the geophysical imagery. Most methods identified a range of 17-21 clusters, but the Walktrap method, by far the noisiest, detected 48 clusters, including many small ones that don’t seem to relate to any known geology.

Figure 3: Clusters determined using Louvain (Potts modularity), Louvain (Dugue modularity), walktrap and Leiden methods (clockwise from top-left).
Some clusters have a strong overlap with a particular lithology, such as the upper Gawler Range volcanics. Areas associated with this unit generally have a clear, distinct pattern in the geophysical data. Also the Gairdner Dyke Swarm which creates prominent features in the magnetics is clearly reflected in the cluster maps (Figure 4), demonstrating how data-driven modelling such as this can draw important information out of data. On the other hand, some lithologies share very similar geophysical character, and cannot be distinguished from gravity and magnetics alone.

Figure 4: The north-east section of the test area showing the Archaean to Mesoproterozoic basement overlain by the dykes (black lines), and the TMI data that contains lines caused by these dykes.
To obtain a more quantitative comparison between the different methods, three mapped lithologies that had distinct areas were chosen and compared to the main cluster that they intersected (Table 1). The percentage of overlap between the lithology and the cluster was used as an indicator of how well the cluster was identified. The Louvain (Potts) method had the best results, consistently reaching the highest or near to the highest coverage. As expected, the Walktrap method performed the worst.
The results varied by lithology, with all methods producing similar results for the upper Gawler Range Volcanics. This indicates that the geophysical texture of this lithology is highly distinct from that of the surrounding rock. The Moondrah Gneis had a poor overlap overall, suggesting that it is difficult to distinguish this lithology based on geophysical texture alone.
| Method | Upper Gawler Range Volcanics | Moondrah Gneis | Munjeela Granite | Average % |
| Dugue | 87 | 48 | 60 | 65 |
| Leiden | 82 | 34 | 98 | 71 |
| Potts | 85 | 52 | 99 | 79 |
| Walktrap | 87 | 33 | 58 | 59 |
Table 1: Percentage overlap of the dominant cluster for each lithology.
Conclusions
Unsupervised community detection models and computer vision methods offer a great way to enhance geological mapping. The information gleaned by these methods, depends on quality and type of data input. In this case shown here, lithologies with distinct geophysical texture will be much better identified. Community detection methods offer a great way to detect groups in data, but different methods will produce different results, so as always it takes a domain expert to compare outcomes and assess the geological reasonability of the results.