
Created by Sam Johnson and Yasin Dagasan
This blog post is a summary of Johnson et al., 2024. “Automated extraction of discing regions from core photography using computer vision at Sunrise Dam”. Presented at Deep Mining 2024 – 10th International Conference on Deep and High Stress Mining: 16-18 September 2024, Montreal, Canada.
To access the full paper, follow this link for the Australian Centre for Geomechanics’ online repository https://papers.acg.uwa.edu.au/p/2465_03_Johnson/
Introduction
As the global mining industry seeks to meet the ever-increasing demand for metals, it continues its push for efficiency and accuracy, the need for high-quality geotechnical data has never been more pressing. Traditional core logging methods, while valuable, often suffer from subjectivity, inconsistencies, human error, and time-consuming processes. But what if we could automate this critical task using artificial intelligence? Datarock developed a geotechnical product “Discing Analysis” within its Datarock Core software that showcases how computer vision is transforming the way we extract valuable geotechnical data—specifically, the detection of discing regions in drill core photography.
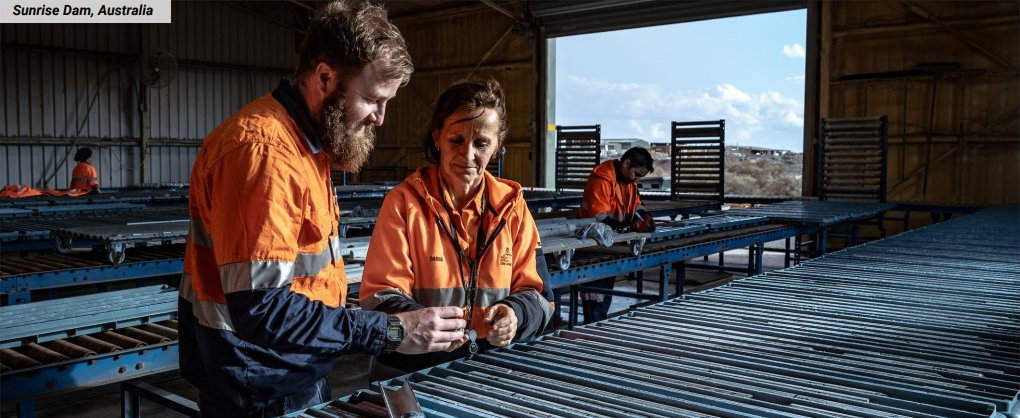
This product was applied at AngloGold Ashanti’s Sunrise Dam Gold Mine (SDGM) in Western Australia, where it had been proactively identified that a reliable discing dataset was required to better characterise the rock mass. The intent was to identify areas of high stress to build into hazard mapping and risk amelioration strategies.
The integration of computer vision in geotechnical data collection at SDGM has the potential to enhance mining safety and efficiency, providing a standardised and reliable approach to understanding in situ stress conditions in rock masses.
What is core discing and why does it matter?
Core discing is a phenomenon where a diamond core fractures into thin, disc-shaped segments when relieved from high in situ stress during drilling. Understanding discing can be very important for geotechnical engineers, as it provides insights into subsurface stress conditions and potential structural hazards.
Traditionally, logging discing has been a manual, labour-intensive process, prone to variability depending on the expertise of those logging or focus of the drilling campaign. This variability is exacerbated by the fact that the requirement to log discing regions is often added later once it is anticipated that areas of high in situ stress exist.
How do we analyse drill core imagery?
We worked with AngloGold Ashanti to review the performance of the analysis on core photography from its Sunrise Dam Gold Mine in Western Australia. The key steps of this workflow are shown in the diagram below.

Figure 1. Overview of the workflow to extract discing regions from core imagery.
We provide a brief summary of each key step here.
- Depth registration
Assigning a correct downhole depth to each row of core will ensure spatially accurate output. While not the focus of this case study, it’s important to understand that this can be done efficiently over hundreds / thousands of drill holes using the Datarock Core software.

Figure 2. Example of depth-registered core rows generated by the Datarock Core software. Each row has been assigned depths from and to, including detected depths based on handwritten metre marks (green markers) and inferred depths (yellow markers).
- Angle-based analysis
We measure the angle of every fracture with respect to the core axis and analyse these measurements to identify regions of thicker discing. With this process, we are also able to include additional interval data such as discing spacing and angle statistics.

Figure 3. Example of fracture detections within a discing zone.
- Region-Based Detection
We detect zones of thin or crushed discs to ensure we capture all discing regions, even if we can’t measure individual angles.

Figure 4. Complex discing regions shown on the left end of the image are better suited for detection by the region-based approach rather than the angle-based one.
- Combining results
As a final step, we merge the results of the angle and region based analyses to generate intervals of core discing based on a transparent and consistent workflow. The Discing Analysis includes configuration, allowing the following parameters to be adjusted:
- Maximise thickness of a disc, allowing differentiation between discing and closely spaced joints
- Minimum number if discs required to define a discing region
- Maximum distance between adjacent discing regions to merge into one region i.e. definition of lumping
This approach allows site or corporate engineering teams to create a standard discing definition, facilitating high confidence in the data.
Key findings and implications for mining
The study’s results identified many discing regions that had not been logged. While this was expected as logging of this dataset had not historically been a focus, there were some holes such as in Figure 5 where logging was included but missed intervals.
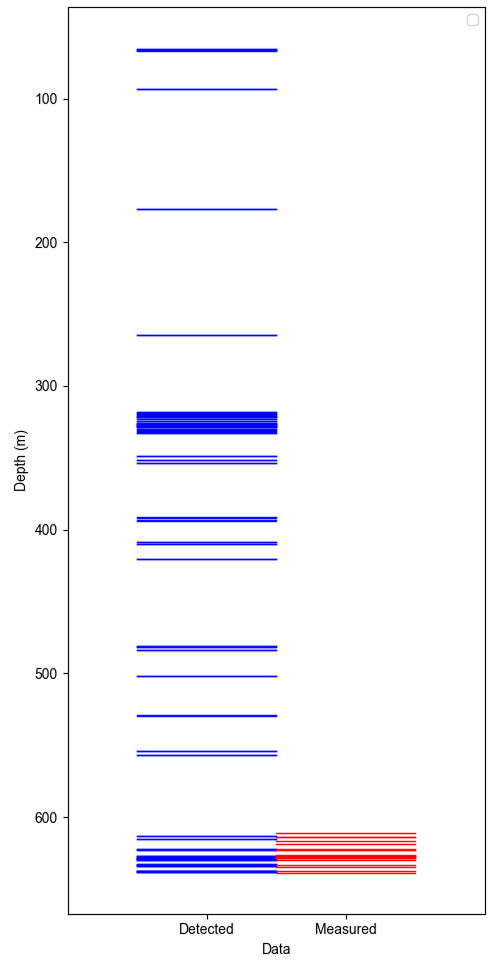
Figure 5. Downhole plot comparing detected and logged discing regions.
In addition, it was found that results such as these highlight several advantages of utilising Datarock Core to identify discing regions as part of a wider rock mass characterisation process:
- Improved accuracy: The system successfully detected discing zones with high correlation to both manual logging and structural models of the mine.
- Efficiency gains: Processing 85,000 metres of drill core imagery manually would take months. This method achieves it in hours.
- Enhanced geotechnical risk management: By detecting previously unlogged discing regions, the approach enables better hazard mapping and risk assessment.
- Standardisation of data: A major challenge in geotechnical logging is inconsistency in how discing is recorded. AI provides a uniform, repeatable method that reduces subjectivity.

Figure 6. Correlation between discing regions and shear/fault structures. The colours indicate the distance between the discing locations and the shear/fault structures.
Conclusion
Datarock Core’s Discing Analysis product was successfully developed at Sunrise Dam Gold Mine, leading to an increased understanding of how discing regions relate to shear/fault structures. As mining operations continue to adopt domain led AI, and machine learning products, we can expect even greater advancements in geotechnical data collection, risk management, and mine optimisation.
At Datarock, we’re continually experimenting and developing new approaches to generate insights from new and existing data. As we receive feedback from industry, and as computer vision technologies continue to evolve, Datarock Core will strive to provide ever more valuable datasets, helping mining companies to make smarter, more informed decisions.
Acknowledgements
We would like to thank Callen Banff and AngloGold Ashanti for their contribution to this paper and permission to publish using their core imagery.
